Visualization Tools

See Your Data Like Never Before with Foji's Visualization Suite

AI Data for Dental, Healthcare & Other Industries

Man in white shirt sits at retro console with charts, dials, buttons, and rotary phone, looking at graphs.
Why Choose Us

Comprehensive Features for Seamless Data Management

Key Capabilities

Interactive & Customizable Dashboards

  • Real-time RCM monitoring — track collections, claim status, verification completion, and outstanding balances as they update throughout the day
  • Practice and location-level views — see performance across a single office or roll up data across every location in your DSO simultaneously
  • Drill-down capabilities — start with a high-level overview and click into any metric for the granular detail behind it
Get Started
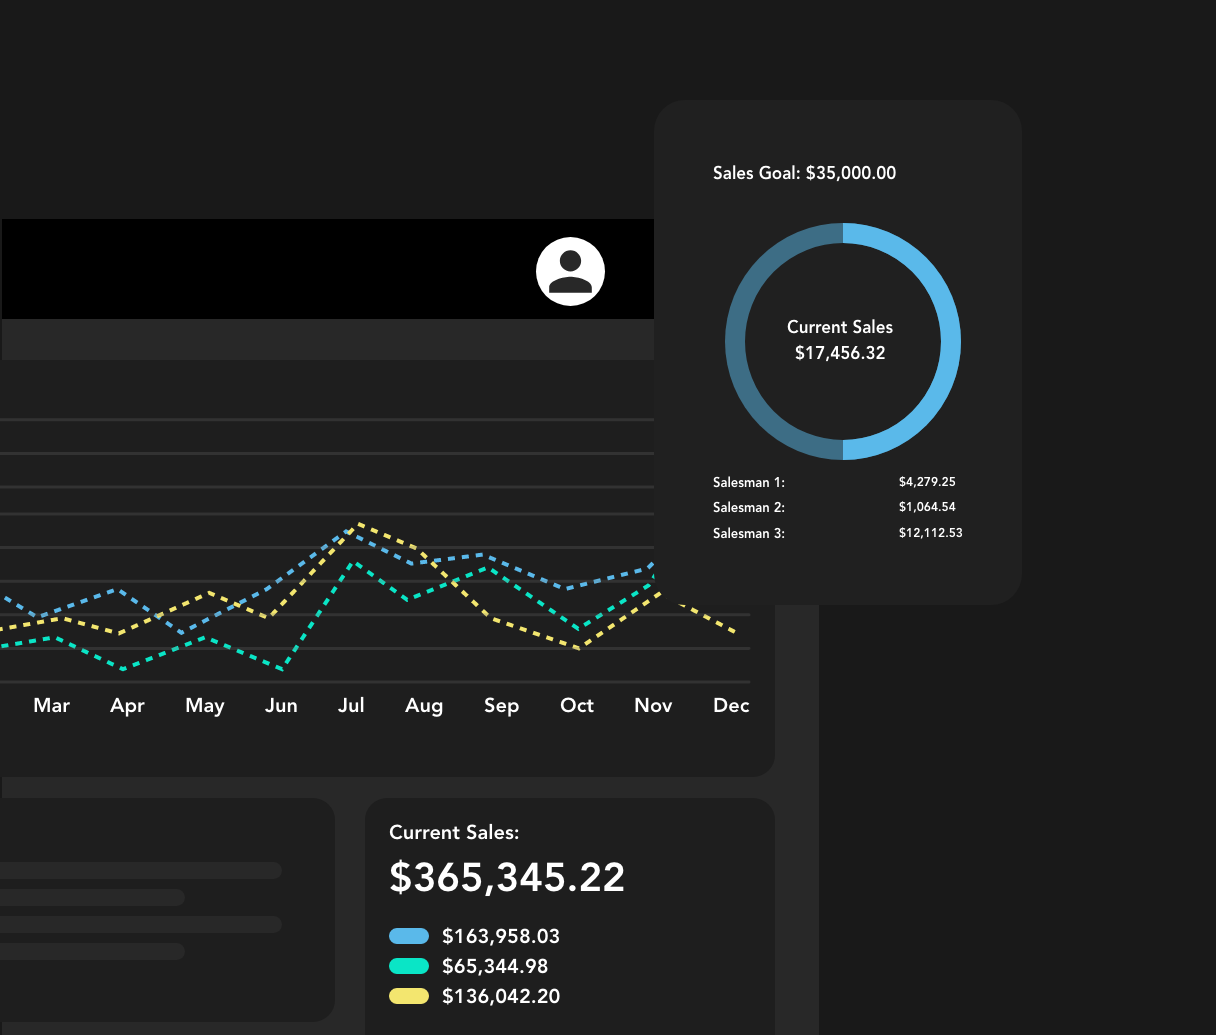
Dashboard showing sales line chart, total current sales $365,345, and sales goal progress donut chart.
Key Capabilities

No Data Team Required for your DSO or Practice

  • No-Code Customization: Build reports and dashboards without technical expertise.
  • Scales from a single practice to a multi-location DSO without adding complexity or cost
  • Get a dedicated Foji team member to assist in building and deploying actionable insights into your data
See Foji in Action
Dashboard showing $102,733.45 sales in March and sales projection line graph for January to March.
Key Capabilities

From Reporting to Prediction, Across any Industry

  • Predictive analytics — use historical data to forecast revenue, patient demand, and RCM performance
  • Time-series analysis — track how collections, claim approval rates, and verification completion change over time
  • Trend identification — spot patterns across locations, carriers, and procedure types before they become problems
Get Started
Dashboard showing sales line chart, total current sales $365,345, and sales goal progress donut chart.
Visualization Tools

Turn Your Data Into Actionable Insights

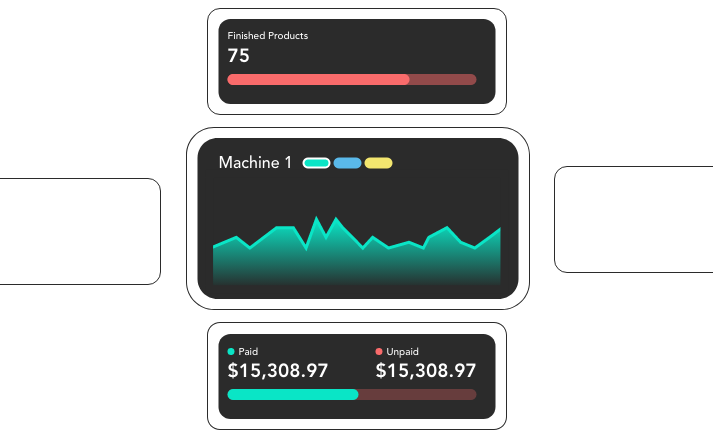
Dashboard with finished products at 75, Machine 1 line graph, and equal paid and unpaid amounts of $15,308.97.

Full Customization

Dashboards and reports built around your specific metrics — collections by provider, claim performance by carrier, verification status by location, or anything else your organization tracks.

Dark-themed user interface showing a patient status table with action icons and status indicators.

Works Across Any Industry

Foji's visualization tools aren't dental-only. Manufacturing operations, healthcare organizations, and enterprise teams use the same platform to centralize and visualize data across their entire operation.

Bar chart showing Q1 financial values increasing monthly from $110,178 to $533,633 with 12% last quarter growth.

AI-Powered & Real-Time

Data that updates automatically as your day runs, no manual exports, no scheduled reports, no waiting until end of month to see how you're tracking.

Less admin. More patients. Starting now.

See Foji running inside your practice management software and find out how much time your team gets back

See Foji in Action
Large picture 3